A page that will not open can be frustrating, especially when you are waiting to pay, publish or get back to work. Our Website Down Checker gives you a second perspective: enter the public address, see what answered, and choose a sensible next check. We keep the result specific to the URL and time tested, so a missing page is not mistaken for a worldwide outage.
How do I check whether a website is down?
Enter the address that matters
Use the exact failing page when a link is broken, or the homepage when the whole site appears unavailable. We add HTTPS to a bare domain. Share links fill the input but never run a check automatically.
Read the result and its time
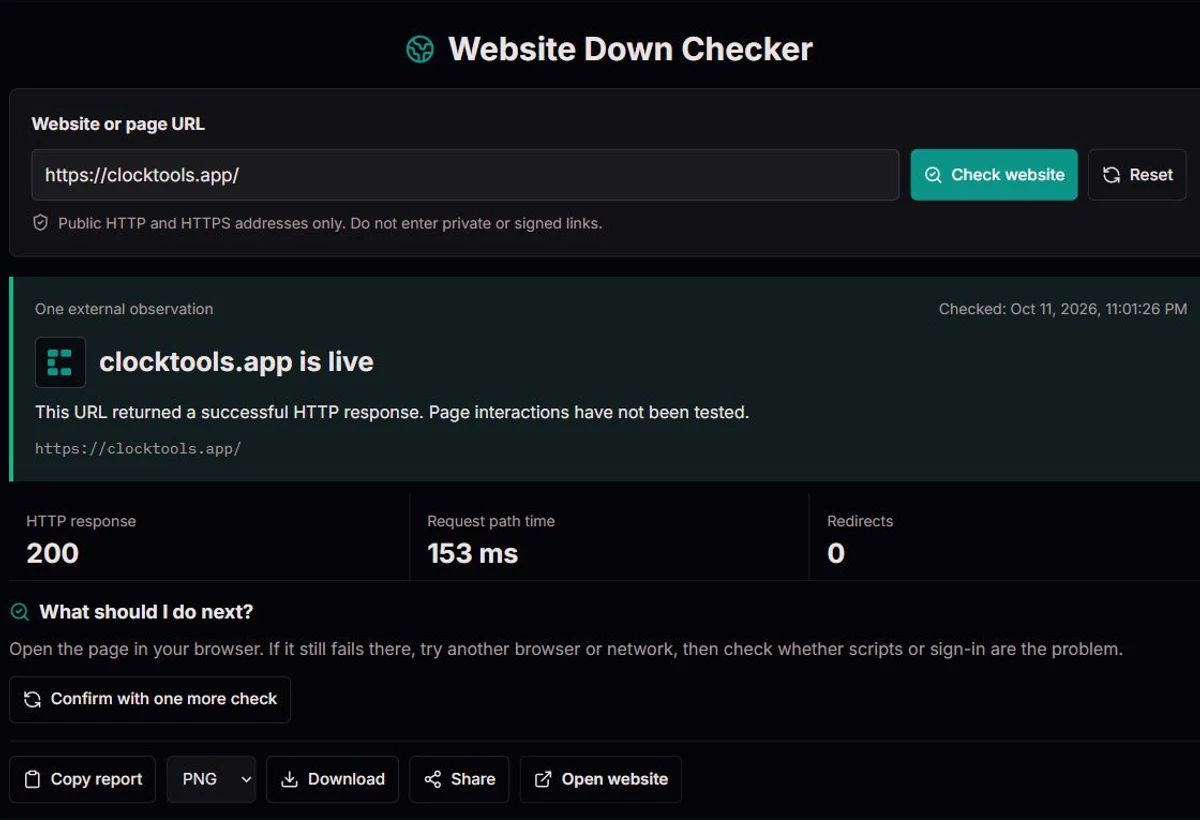
Check the hostname, HTTP code and timestamp first. Expand the evidence for DNS addresses, request timing and redirect steps. “Not verified” means we did not observe enough evidence, not that a test passed.
Confirm, compare or keep a report
Confirm performs one additional observation after a short pause. Homepage comparison checks the root page separately. Copy or download PNG, TXT or JSON to keep the times, results and boundaries together.
Checks for real situations
A customer cannot open a product page
Check the product URL, then compare with the homepage. A successful homepage beside a 404 product page points to the link or route, rather than proving the entire shop is offline. A successful response still does not test payment.
Your newly published site looks unavailable
Review the DNS stage and final destination after a domain or hosting change. Record the time and the public addresses returned. Avoid repeatedly changing settings before you know which layer needs attention.
An online service works for someone else
Keep the external result alongside your browser error. Try a different network or browser without changing account credentials. A difference is useful evidence for support, not a reliable diagnosis of a country-wide outage.
You need a useful support ticket
Download a branded report with the exact URL, timestamp, code and observed redirect path. Describe what failed in your browser separately. Remove sensitive query values before sending the report to another person.
What can our checker help you establish?
Understanding website availability
Why does a website work for one person but not another?
When someone says “the site works for me,” they are describing one journey, not settling the whole incident. Your device, browser state and network can differ from theirs. An external website downtime check adds another observation without pretending that either person is wrong.
Start with small comparisons: the same URL in another browser, then another network if one is available. Keep the time, error and HTTP result. Change one thing at a time so you can tell which change helped. Do not disable security software broadly just to make a page open.
Our result is most helpful as evidence beside your own experience. If the URL answers here but stays blank on your device, move on to rendering, cookies, extensions or sign-in. If both checks fail, the matching observations justify further investigation, not a claim that everyone is affected.
Is one broken page the same as a website outage?
A link can be wrong even when the surrounding website is healthy. Product pages disappear, old campaign links survive in emails, and a deployment can change a route without updating every bookmark. Checking the exact path keeps those cases separate from checking the domain.
Use Compare with the homepage to collect a second result without losing the first. A homepage success and a page error narrow the next question to that route. Two server errors suggest a broader issue, but a public homepage can remain available while another part of an application fails.
Preserve the full failing path when contacting support. A screenshot of “the site is down” without its URL makes reproduction much harder. Our reports put the URL and time beside the result so the person investigating knows what was actually checked.
What do HTTP codes tell us, and what do they leave unanswered?
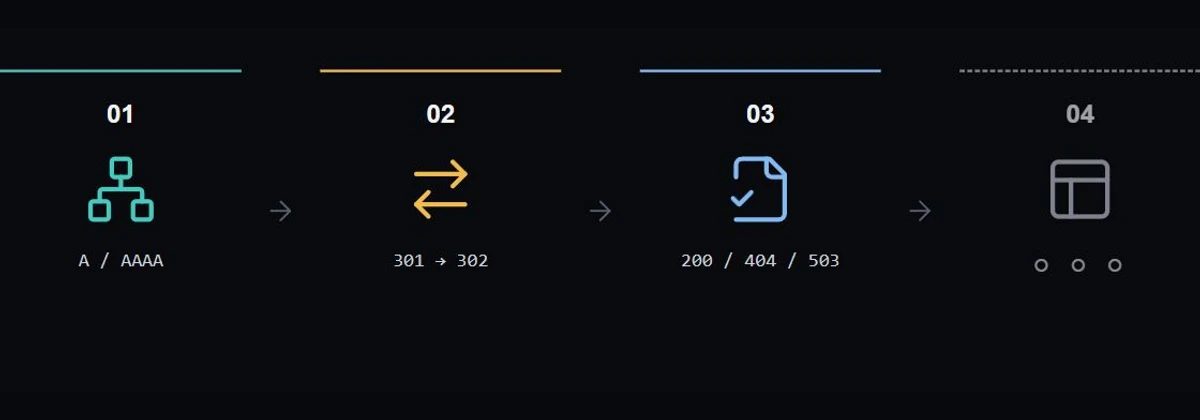
HTTP responses describe how a request was handled. The HTTP status-code reference explains the families: 2xx success, 3xx redirection, 4xx request-related errors and 5xx server errors. A 403 refusal and a 404 missing page are therefore different from receiving no response at all.
An answer is not an explanation of the root cause. A gateway error cannot tell you which deployment, dependency or network path broke. Website owners need their own logs; visitors can usually only preserve evidence, wait and contact the service.
A Retry-After value asks the client to wait before another request. Our follow-up buttons respect a usable delay or date instead of repeatedly hitting a restricted service. If no delay is supplied, a brief pause still makes a confirmation more considerate than rapid clicking.
Can an HTTP 200 response still lead to a broken page?
Yes. The address can answer successfully while the page shows the wrong content, a sign-in prompt or an error message. It may also need scripts and other requests before it becomes useful. Our availability verdict does not run those interactions.
Think of the response as a door opening, not proof that everything inside is ready. A customer can reach a shop’s homepage and still be unable to add an item or pay. That is why our result says the URL answered, rather than certifying an entire business process.
Google’s description of JavaScript processing distinguishes fetching a page from rendering it. For practical diagnosis, open the site yourself and use our rendering tool when appearance is the next question. Test an account or checkout only with permission and appropriate test data.
How did DNS make website addresses useful at scale?
Readable names let people remember a service without memorizing a numerical address. RFC 1034, published in November 1987, documents a distributed, hierarchical naming system and caching. That architecture helps explain why naming and website availability are separate questions.
Finding a public address does not mean a web application answered there. Conversely, a naming failure can stop a check before an HTTP request is possible. Our evidence separates the lookup from the response so those two conditions are not merged into a vague red badge.
After changing a domain’s configuration, keep a record of what you changed and when. Cached answers can complicate comparisons. The TTL shown here describes returned records; it is not a countdown guaranteeing that every network will adopt a change at the same moment.
Why can one check not tell me a website’s uptime percentage?
A one-time answer has no denominator of historical observations. Two confirmation checks are still only two observations. We do not invent a 24-hour chart or a percentage from them. Google’s service-level guidance discusses availability as a defined indicator over a defined period, rather than a single green result.
For a simple teaching example, imagine a complete 30-day observation period with 43,200 minutes and exactly 30 minutes unavailable. Time-based availability would be (43,200 − 30) ÷ 43,200 × 100, approximately 99.9306%. These are hypothetical inputs, not measurements made by our checker.
Real monitoring also needs a definition of failure, missing-data handling and a decision about which user journeys count. A static homepage and a payment endpoint can deserve different checks. Use a dedicated monitoring service for scheduled observations and alerts; use our tool for a focused investigation now.
What should I record before reporting downtime?
Keep the exact public URL, time and timezone, visible browser error and our result. Say whether you were using a VPN or a different network when it mattered. Never include passwords, session cookies or signed access links in a public report.
For site owners, compare the incident time with recent releases, DNS changes and available logs before making several changes at once. Reproduce the smallest failing action. If a homepage comparison succeeds, investigate the failing route rather than assuming the entire server needs restarting.
When access returns, keep the earlier result instead of rewriting the incident as if nothing happened. A changed confirmation result is a useful recovery clue. It does not establish exactly when the problem began or ended, because the time between observations was not continuously measured.
Accuracy, boundaries and corrections
We make an anonymous external request to the public address you enter, inspect public DNS, follow allowed redirects and classify the observed response. DNS time is the lookup interval. Request-path time covers the HTTP journey, including redirects and their destination lookups; final-response time covers only the last request up to its headers. An unfinished journey has no verified final-response time or connection scheme.
This is not continuous or multi-region monitoring, a certificate audit, a browser-rendering test or a logged-in user journey. Cancel prevents a late result from changing your screen; an already-started external request may still finish within its server-side limit. Addresses with query parameters are sent when you explicitly check them but are excluded from local history. Share and download only public, non-sensitive addresses.
If a result seems wrong, save its URL, timestamp, status and failed stage, then confirm once or compare the homepage. Send us the non-sensitive evidence through our contact page. We review classification, wording and reproducible defects; we cannot change another website’s response or retrospectively measure an unobserved outage.
Questions you might have
Is my site down, or is it just me?
An external success beside a browser failure suggests different access conditions, not a guaranteed local cause. Compare another browser or network. An external failure needs confirmation and the recorded failed stage before drawing a broader conclusion.
Does a 403 or 429 mean the website is offline?
No. The server answered but refused or limited the request. Try a normal browser and respect any retry time. We label these results as restricted rather than calling the entire website down.
Does a 404 mean the whole website is down?
No. It concerns the requested page. Compare the homepage and check the URL path. A missing page and an unreachable host require different follow-up actions.
Why does the response time differ from my browser?
Our timing describes an external request path, not a complete page load on your device. Redirects, network paths and browser activity can differ. It is not an internet-speed measurement.
Can I check a private network or signed URL?
Private and local destinations, embedded credentials and unusual ports are not allowed. Do not submit signed or secret links. Query parameters are preserved for an explicit public-page check, so review them first.
Does confirmation check different countries?
No. It makes one more observation and keeps both times. It does not select another country, run global monitoring or calculate historical uptime.
What is included in a downloaded report?
The URL, time, verdict, HTTP result, DNS evidence, recorded redirects, timing and limitations. Follow-up observations are included when present. PNG also includes ClockTools branding and the tool link.
What happens when I cancel or reset?
The current browser request is cancelled and older results cannot replace the screen. Reset also clears the input and visible results. An external request that already started may still complete within its own deadline.