Step 1
Choose an allowed target
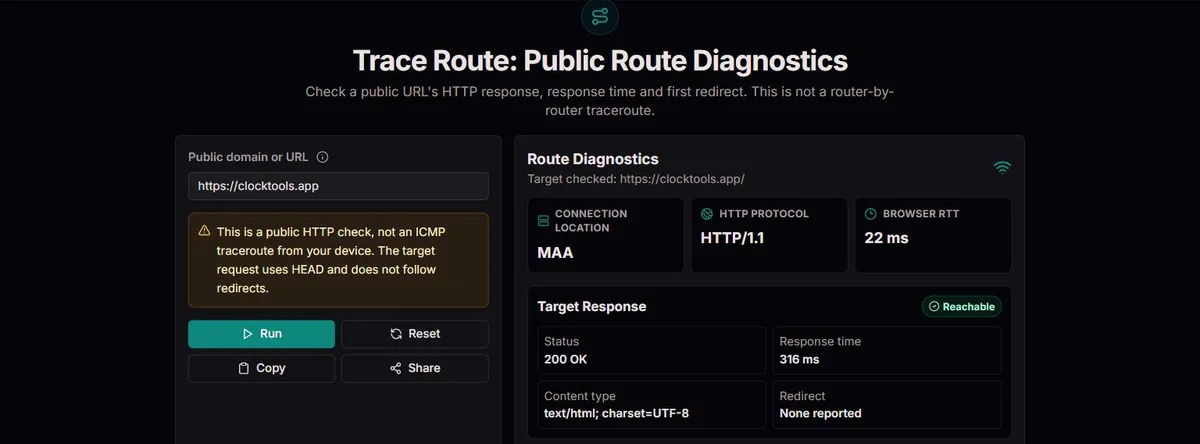
Illustrative example, not a live result
https://clocktools.app/Enter a public HTTP or HTTPS URL without credentials or a custom port. Test only a destination you own or may inspect.
Compare browser-to-service context with an outside HTTP response check. Inspect timing and redirects without invented router hops.
Compare browser-to-service context with an outside HTTP response check. Inspect timing and redirects without invented router hops.
https://clocktools.app/Enter a public HTTP or HTTPS URL without credentials or a custom port. Test only a destination you own or may inspect.
Browser → service → targetRead browser-to-service connection details separately from the service-to-target HTTP request. They are different paths.
JSONExport the report with its timestamp, then compare with a local browser or terminal test. Cancel a check before changing targets.
Your laptop cannot open a public site, but the outside check receives a response. Keep the same scheme, hostname and path while testing another browser or network. Compare anonymous access first, then investigate local DNS, VPN, extensions and access rules one change at a time. The response narrows the question; it does not certify availability for every visitor.
After moving a public page, check the old URL and read the first response and Location header. A redirect can explain why a browser reaches another address, but this tool stops there. Check the destination separately if you are authorized to inspect it. Keep both observations in a migration ticket rather than marking a redirect as an already verified final page.
For an intermittent incident, copy or download JSON with the URL, time, status, approximate elapsed time and browser-to-service context. Add what failed in your own browser and on which network. If support needs router hops or repeated loss measurements, provide authorized terminal measurements separately; the diagnostic stages here are not substitute hop data.
IPv4 routers reduce packet TTL as traffic is forwarded. When the limit expires, ICMP time-exceeded messages can reveal the responding router. A terminal traceroute varies probe limits and records replies rather than downloading a webpage.
This page sends no TTL-controlled router probes. Its HTTP timing includes the outside request and service overhead; client TCP RTT, when supplied, describes a separate browser-to-service connection. Neither value is a hop count or a pure target ping. ICMP specification.
Router requirements describe TTL and forwarding behavior, but routes and replies can vary. Even a terminal trace may show gaps when devices filter or rate-limit responses. Missing replies are not automatically packet loss in an application.
Here a target HTTP 403 or 500 is still an observed response. A timeout is narrower: no usable response was received within the limit. Compare the same URL, method, network and observation time; a browser GET can differ from the diagnostic HEAD request. IPv4 router requirements.
These are illustrative values. Suppose the outside check receives 403 in 240 ms, while your logged-in browser opens the page. This demonstrates an access difference, not a broken router or a complete outage. The checker sends no browser cookies; compare anonymous access and firewall rules.
Enter the actual public HTTP or HTTPS URL you want to investigate. Scheme and path matter: http:// can redirect while https:// answers directly, and the homepage can work while a specific path fails. The input is not a port scanner; credentials, private destinations and custom ports are not accepted. Use a normal non-sensitive URL rather than an account-reset or signed download link.
There is no hop-count, packet-size, probe-count or request-method control on this page. The outside request uses HEAD and does not follow redirects. This is useful for asking whether a destination returns headers without treating it as a page download. HTTP method semantics explain the distinction between HEAD and GET; a browser visit normally asks for content and can trigger further resource requests that this check never makes.
Run a check, wait for the result and export it before changing the conditions. Cancel or reset when switching targets; those controls prevent an old client result from taking over the new view. Share prepopulates the target for another deliberate run, not the measured result. A new run can legitimately differ as the service, network or target changes.
The first observation is the connection that brought your browser request to ClockTools. When supplied, HTTP protocol, TLS version and client TCP RTT refer to that connection. The second observation is a separate anonymous request from the checking service to your target. The diagram’s stages organize these observations; they are not a map of the routers between your laptop and the website.
The target elapsed time includes public DNS checks and the outside request until a response is obtained. It is not pure server processing time, bandwidth, a page-load duration or a target ICMP round trip. Do not subtract the browser’s TCP RTT from it, add the two into a “total ping,” or divide it by the displayed stages to invent per-hop latency. They have different endpoints and measurement boundaries.
For a fixed example, browser-to-service RTT of 18 ms and target elapsed time of 240 ms can coexist without identifying a slow link. A DNS check, connection setup, access layer and target response can all contribute to the latter. If a connection field is unavailable, leave it unknown. A displayed service location also does not establish the physical route, exact client location or location of the origin behind a proxy.
A completed diagnostic stage means that a response was obtained, not that the page worked. Read the HTTP status next. A 200 response says this request succeeded at the HTTP layer; it does not show a rendered page, login success or working checkout. A 403 or 500 establishes a response too, but calls for access-policy or application investigation rather than a claim that no server could be reached.
A 301 or 302 reports only the first redirect. Location may be relative, so interpret it in the context of the checked URL rather than blindly pasting it as a hostname. This tool does not prove that the next destination is safe, reachable or free of a loop. Save the original response, then perform a separate authorized check of the intended public destination.
A server can treat HEAD differently from GET, despite the protocol’s intended relationship. If you see 405 or 501 while a normal browser works, ask the operator whether that method is supported or intentionally blocked. Likewise, an anonymous check can receive a challenge while a logged-in browser gets content. These differences identify a useful comparison, not a reason to bypass a control.
| Outcome | What was observed | Useful next step |
|---|---|---|
| 200 | A successful response to this HEAD request | Inspect the actual page and its interactions separately. |
| 301 / 302 | An initial redirect | Review Location and check the destination separately. |
| 401 / 403 | Authentication or access refusal | Compare anonymous access and the owner’s access rules. |
| 404 | This path was not found | Verify path spelling and compare a known public path. |
| 405 / 501 | Method rejected or unsupported | Compare an authorized GET and review method handling. |
| 429 / 5xx | A limit or server-side response | Pause retries; consult the operator’s relevant logs. |
If no usable HTTP response arrives, start with the reported error rather than the elapsed number. A DNS-not-found result points toward spelling or name resolution. DNS-unavailable is less conclusive: the resolver check itself could not establish usable public answers. Neither is an expiry test. For a domain you manage, compare its intended A and AAAA records and current DNS delegation using your normal administration tools.
The outside check has an approximately 6.5-second overall deadline, including its DNS stage. A timeout means this attempt did not produce a usable response within that boundary. It does not isolate a failed router, prove an origin crash or measure packet loss. A connection or TLS-related failure can also appear as a request failure without an HTTP code. Use target logs and an independent authorized test to establish the cause.
When outside and local results disagree, preserve the exact URL and time. Try an anonymous browser window, then compare another network if available. Change one variable at a time: network, VPN state, browser or request method. If both local and outside checks fail, escalate with the observed evidence rather than calling it global downtime. One outside vantage point is not a multi-region monitoring system.
A conventional traceroute sends probes with increasing packet lifetime limits and associates returned replies with those probes. The ICMP specification describes time-exceeded messages; IPv6 uses a Hop Limit in its base header. That engineering mechanism is fundamentally different from retrieving HTTP headers. ClockTools does not send those controlled probes or reconstruct a router list from an HTTP response.
Use a suitable local terminal tool on an authorized destination when the question concerns responding hops. Note the source network and probe type alongside the result: a trace from another machine is not automatically your route. Keep that output separate from this JSON report so a support engineer can distinguish packet-probe observations from application-level response evidence.
Even terminal output needs interpretation. A device may decline to answer probes while forwarding ordinary traffic, and paths or replies can vary between attempts. An unanswered intermediate hop alone is not proof that an application loses packets there. Begin with the user-visible failure, compare the destination behavior and use repeated authorized measurements when that separate investigation is warranted. Do not infer router names, physical distances or responsible providers from the three stages on this page.
The report separates browser-to-service context from a fresh public-DNS check and anonymous HEAD request to the target. It records the first HTTP response, selected headers and approximate elapsed time without following redirects. Missing connection fields remain unknown. Copy and JSON export preserve the observation time; cancel and reset prevent late client results from replacing the current view.
No router hops, per-hop latency, end-to-end packet loss or terminal traceroute are measured. This is a single outside observation, not a global availability check, page-load benchmark or uptime monitor. Public destinations only are accepted. A failure needs interpretation with the exact URL, request method and time; it does not by itself identify the failing network layer.
Report a reproducible problem with the page URL, safe input, checked-at time, expected result and source evidence through the Contact page. Include the public source response when possible, without account details or secret links. A changed source record is not necessarily a calculation error. Compare the same name, page and observation time before requesting a correction.
No. It separates your connection to ClockTools from an outside HTTP check of the target. The displayed stages are not routers. For actual responding-hop measurements, use an authorized terminal traceroute or tracert from the relevant network and keep that evidence separate from this report.
Complete means an HTTP response arrived. A refusal or server error is still a response, so it cannot be described as no connectivity. Read the code and compare access policy or application logs. The report does not certify that the intended page or user workflow works.
No. You see the first response and its Location header when supplied. The destination has not been checked. If the location is relative, resolve it against the original URL; inspect the intended public destination separately rather than reporting the first redirect as a successful end-to-end journey.
Your browser may use GET, cookies, cached content or a different network, whereas the check is anonymous HEAD from outside. Compare the same URL anonymously and review method and access handling. A 405 or challenge response can explain a difference without establishing a routing outage.
No. It includes DNS checking and the outside HTTP operation. Browser TCP RTT, when available, describes another connection to ClockTools. Neither is a target ICMP ping, and adding or subtracting them does not create a valid end-to-end network measurement.
Only that this attempt did not obtain a usable response within its approximately 6.5-second deadline. DNS, connection setup, access handling and the target can all affect it. Keep the error and timestamp and compare a separate authorized test; the timeout cannot name a failed router.
No. This page accepts allowed public HTTP or HTTPS targets on standard ports. Private addresses, credentials and custom ports are rejected. Use your organization’s authorized local tools for internal services; do not try to route around the restriction with another hostname.
No. It is one observation at one time. Different networks and access policies can receive different responses. Compare independent networks and the operator’s monitoring before making a wider incident claim, and include the source conditions in any support ticket.
No. A share link prepares a target for a deliberate new check. Copy or download JSON to preserve the old observation. Neither sharing nor leaving the page open creates scheduled monitoring, and another user’s run can differ because the request context and time have changed.