Network Diagnostics
What Does Traceroute Show? How to Read the Results
Traceroute shows responding network hops and source-to-hop round-trip samples. Here is how to read the output without mistaking silence for failure.
By Vigneshwaran Vijayakumar, Developer and Publisher | | Reviewed under the ClockTools editorial policy

Table of contents
Traceroute looks more certain than it really is. The output arrives as tidy numbered lines, but those lines are observations from a series of probes—not a perfect map of the internet.
Traceroute shows the responding Layer 3 hops between a source and destination, plus round-trip response samples from the source to each hop. It does not guarantee that every router is visible, measure the delay between two neighboring hops, or prove packet loss. A blank response can simply mean that a device chose not to answer the probe.
What traceroute actually shows
A classic traceroute tries to reveal the path one response at a time. For every visible hop, it can report a hop number, an IP address, an optional hostname, and one or more round-trip time samples. The IETF traceroute measurement model identifies those as the common result fields.
The careful word is responding. A row represents an interface that answered a probe, not necessarily a complete physical router, and certainly not every device that handled the traffic. Two addresses at the same hop number may be alternate responders on a load-balanced path. A missing row may still be forwarding packets perfectly well.
Traceroute is therefore best read as a path observation from one source, at one moment, using one probe method. Run it later, from a VPN, or from another network and the result may change. That is normal routing behavior, not automatically a fault.
The small TTL trick behind every hop
The mechanism is clever. In IPv4, every forwarded packet carries a Time to Live value, usually treated as a hop limit. A router reduces it before forwarding. When the value expires, that router can return an ICMP Time Exceeded message instead of passing the packet onward.
Traceroute first sends one or more probes with TTL 1. They expire at the first routed hop. The next set uses TTL 2 and can reach one hop farther. The process continues until the destination answers or the tool reaches its configured maximum. IPv6 uses a field literally named Hop Limit, but the discovery idea is similar. The protocol details are documented in RFC 5388 and the IPv6 specification.
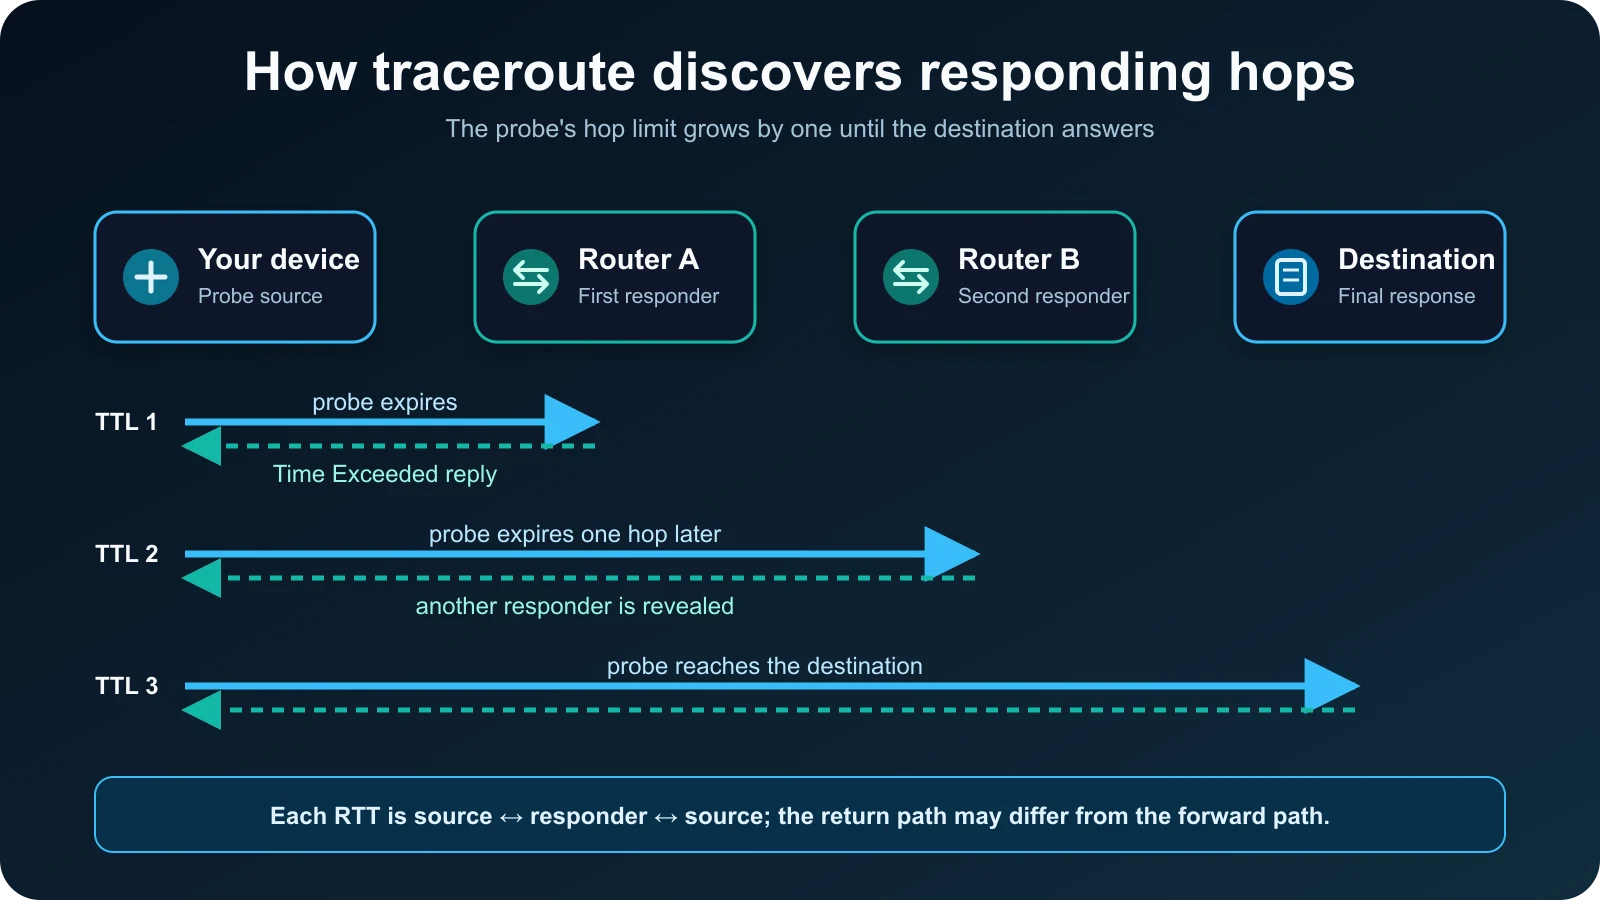
The destination response depends on the implementation. A traditional UDP-based trace often finishes when the destination reports that the chosen port is unreachable. Windows tracert uses ICMP Echo probes and finishes when the destination replies. TCP-based variants also exist. This is why two traceroute programs can take the same basic journey while sending different kinds of probes.
How to read one line of output
Consider a common Windows-style line with a hop number, three time values, and an address. The columns are simple once you stop asking them to do more than they can.
| Field | What it means | What it does not prove |
|---|---|---|
| Hop number | The TTL or Hop Limit step used for that row | The router's physical distance or ownership |
| Three RTT values | Three separate source-to-responder-and-back samples | Minimum, average, and maximum; or delay between adjacent hops |
| Hostname | A reverse-DNS name when resolution succeeds | The device's exact role, company, or location |
| IP address | The responding interface address | Every interface on the router or the return path |
| Asterisk | No response arrived for that probe before timeout | That the router dropped forwarded traffic |
The three middle values deserve special attention. They are three separate attempts. Microsoft describes them as round-trip measurements from your device to that hop and back in its official tracert documentation. They are not three stages of one packet journey, and they are not a ready-made min/average/max summary.
An RTT also includes the reply path and processing time at the responding device. Internet routing can be asymmetric, so the reply may return by a different path. RFC 9198 explains why this kind of ICMP timing is not a reproducible estimate of an application's delay. Treat the number as an end-to-end sample between the source and that responder, not a stopwatch placed on one cable between two routers.
Asterisks are silence, not a verdict
An asterisk means the probe did not receive an answer before its timeout. That is all it means by itself. The router might filter that probe type, rate-limit ICMP replies, deprioritize control-plane responses, or send a reply that is lost on the way back.
One asterisk among two measured times means one of the three probes went unanswered. Three asterisks or “Request timed out” means none of that row's probes answered in time. If later hops—including the destination—still respond, the trace continued past that TTL, so the silent row does not prove a forwarding failure. Multipath routing means those later probes may not have followed exactly the same responder sequence. Microsoft's own example shows timed-out rows followed by a successful destination response.
This is a common bad diagnosis in traceroute reading: treating every silent hop as packet loss. Forwarding traffic and answering diagnostic probes are different jobs. A router can perform the first while declining the second.
For actual loss investigation, use repeated measurements. On Windows, PathPing combines path discovery with a longer series of probes and calculates statistics. Even then, loss reported to an intermediate router should be compared with later hops before you conclude that forwarded traffic is affected.
How not to blame the wrong router
The useful question is not “Which row has the biggest number?” It is “Where does a change begin, and does it persist toward the destination?”
| Pattern in repeated tests | Cautious interpretation | Useful next check |
|---|---|---|
| RTT rises at one hop and stays high through the destination | A change may begin near that point, but the return path still matters | Repeat at another time and compare from another network |
| One hop is slow, then later hops are normal | That responder may be slow to answer probes rather than slow to forward traffic | Do not label it a bottleneck from this trace alone |
| Asterisks appear, then later hops answer | The silent device may filter or rate-limit replies | Check the destination result and rerun |
| Different addresses appear at the same hop number | Load balancing or route variation may be involved | Compare several traces instead of merging the addresses into one path |
| Only the destination remains consistently slow | The destination, its network, or the return path deserves closer attention | Compare application timing and service reachability |
Distance, congestion, Wi-Fi, VPN routing, queueing, and responder behavior can all change RTT. A single high sample is a clue, not a conviction. Look for a repeated pattern that continues into later hops and matches the user's actual symptom.
Traceroute also does not measure download or upload capacity. If the complaint is “the connection feels slow everywhere,” an internet speed test checks throughput, latency, and jitter more directly. The two tools answer different questions.
What traceroute cannot show reliably
Traceroute gives a quick path snapshot. Reading it well means knowing what that snapshot leaves out.
- It may not reveal every Layer 3 hop; some devices never answer the probes.
- It normally does not show transparent Layer 2 switches. Those devices forward frames without appearing as IP hops.
- It observes the forward probe path, while each reply can take a different return path.
- It may sample one of several equal-cost routes rather than every possible path.
- It does not establish stable packet-loss percentages from a handful of probes.
- It cannot prove the route every application flow will take, especially when probe protocols differ.
- An IP address or hostname is not an exact physical-location reading.
Use the neighboring test that matches the unresolved question. If a website answers but a particular service does not, a carefully scoped port check can test selected public TCP ports from the ClockTools edge. If private ranges or CIDR boundaries are confusing the trace, the IP subnet calculator helps separate network and host portions.
Tracert, traceroute, and probe types
Windows names the command tracert. macOS, Linux, BSD, and many network appliances commonly use traceroute. The output feels familiar across platforms, but the default probes can differ.
Windows tracert sends ICMP Echo requests with increasing TTL values. Traditional Unix-like traceroute commonly starts with UDP, although implementations and options can also use ICMP or TCP. Avoid the blanket rule that “traceroute always uses UDP” or “traceroute always uses ICMP.” The program and its selected method decide.
For a quick Windows trace without hostname lookups, use tracert /d example.com. On a typical macOS or Linux system, start with traceroute example.com and read that system's manual for protocol and timeout options. The /d flag can speed a Windows trace by skipping reverse-DNS name resolution, but it does not hide the IP addresses in the output.
The term tracepath usually refers to a related Unix-like utility with a different interface and privilege model. MTR and WinMTR repeat probes over time. PathPing adds repeated statistics after discovering the route. Choose among them based on whether you need a quick path snapshot or a sustained measurement.
Where ClockTools fits
A normal browser page cannot open the same raw ICMP, UDP, or TCP probes as a local terminal command. Browser sandboxes and the ClockTools Cloudflare Worker runtime do not expose the required packet TTL control, so ClockTools does not invent a hop table.
The ClockTools Trace Route diagnostic works within that boundary. HTTP protocol and client RTT describe the browser-to-ClockTools leg. A separate public HTTP or HTTPS request runs from the ClockTools edge to the target and reports reachability, status, response time, content type, and redirects. It is useful for a quick outside-in website check, but it is not your laptop's local hop table.
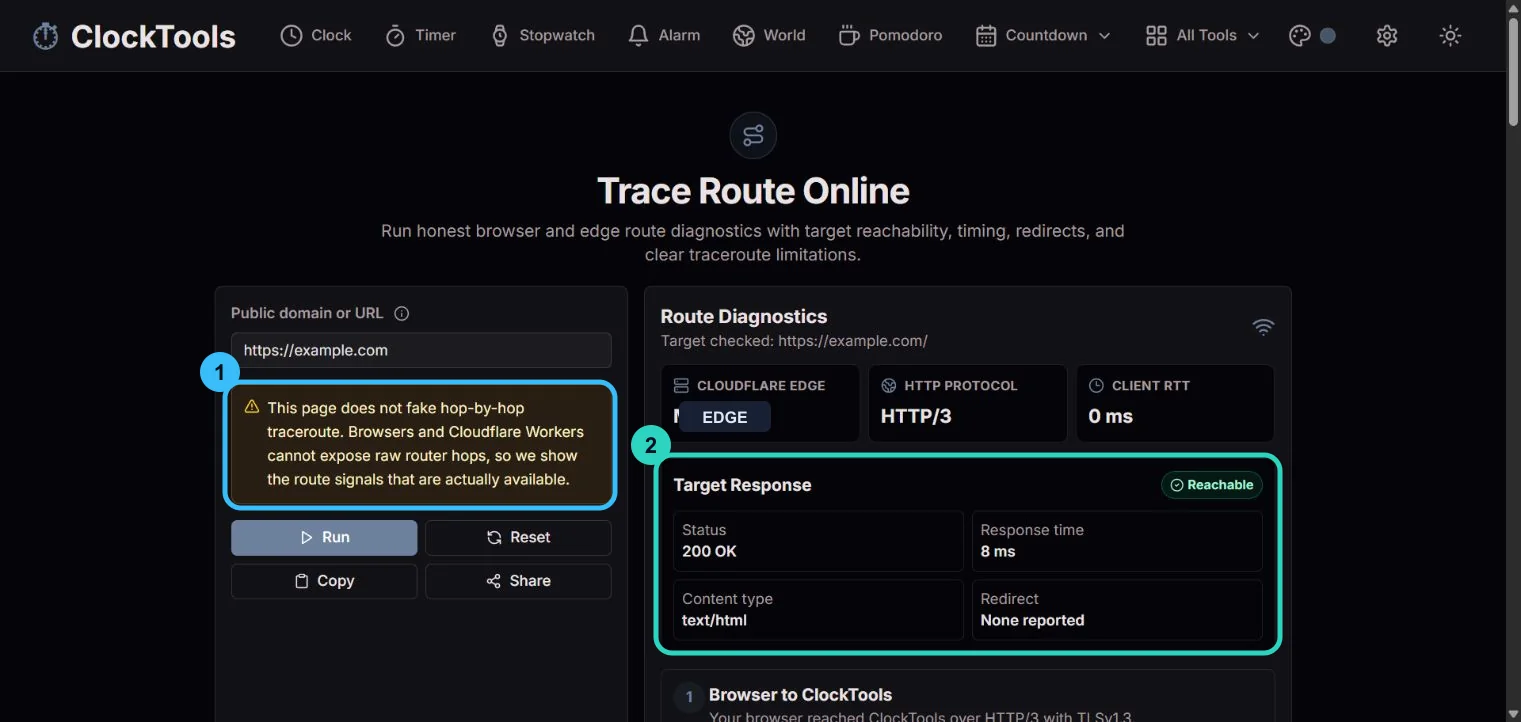
In the screenshot, callout 1 marks the limitation notice; callout 2 marks the target response data. The example uses example.com, a public documentation domain—not a private host—and generalizes the request-specific edge code.
Use a public URL you own, manage, or have permission to test. If the target responds quickly from the edge but feels slow on your device, local Wi-Fi, an ISP path, a VPN, device load, or browser behavior becomes worth checking—but the two tests also originate from different vantage points and may use different routes. If it fails both from the edge and locally, DNS, hosting, firewall, or target availability becomes more plausible.
A practical troubleshooting sequence
Start with the symptom, not the tool drawer.
- Is the website reachable from outside your connection? Run the ClockTools route diagnostic and note status, redirects, and response time.
- Is your whole connection slow? Compare throughput, ping, and jitter with an internet speed test.
- Do you need the local hop-by-hop view? Run
tracertortracerouteon the affected device and network. - Is one service failing while the host responds? Check only the relevant, authorized public TCP port from the ClockTools edge.
- Did a high RTT or timeout appear once? Repeat the trace. Persistent downstream behavior matters more than a dramatic single row.
- Are you comparing public and private addresses? What Is My IP identifies your visible public address, while the subnet calculator helps with private network ranges.
That order prevents a common mistake: using one diagnostic to answer every network question. Reachability, route observation, sustained loss, throughput, and service availability are related, but they are not interchangeable.
Share traceroute results safely
A trace can expose public and private IP addresses, internal hostnames, provider names, timing patterns, and parts of a network's design. Before placing output in a forum, ticket, article, or screenshot, remove details that the recipient does not need.
Redact internal device names, usernames embedded in hostnames, private addressing when topology is irrelevant, and public addresses if you do not want them associated with the post. Keep enough structure for the problem to remain understandable: hop numbers, the presence of timeouts, and representative timings are often sufficient.
Do not assume tracert /d anonymizes a trace. It skips name resolution; it still displays responding IP addresses. Also remember that an IP geolocation guess is not a precise physical location, but it may reveal a provider or broad region.
The best traceroute reading is modest. It tells you which probes received answers, how long those round trips took, and where a pattern may begin. It becomes genuinely useful when you combine that evidence with repeat tests and the symptom you are trying to explain.
Frequently Asked Questions
Is traceroute ICMP or UDP?
It depends on the implementation and options. Windows tracert uses ICMP Echo probes. Traditional Unix-like traceroute commonly defaults to UDP, while ICMP and TCP variants also exist.
What is the difference between tracert and traceroute?
Tracert is the Windows command name; traceroute is the common name on macOS, Linux, BSD, and network systems. They use the same increasing-hop-limit idea, but their default probe protocols and options can differ.
What does * * * mean in traceroute?
It means none of the probes for that hop received an answer before the timeout. The device may still be forwarding traffic, especially if later hops or the destination respond.
Why are there three time values for each hop?
Many implementations send three probes at each hop limit. The values are three separate source-to-responder-and-back round-trip samples, not minimum, average, and maximum values.
Does traceroute show every router?
No. Some routers do not return the expected diagnostic reply, and load balancing can expose different responders. Treat the result as a probe-observed path, not a complete physical inventory.
Does traceroute show network switches?
Ordinary IP traceroute normally does not show transparent Layer 2 switches. It reports responding Layer 3 interfaces discovered through TTL or Hop Limit expiration.
Can traceroute prove packet loss?
Not from one short trace. A missing reply may reflect filtering or rate limiting rather than lost forwarded traffic. Use repeated measurements and compare the behavior of later hops and the destination.
Does traceroute reveal my physical location?
No exact physical location is encoded in a trace. IP addresses and hostnames can still suggest a provider, organization, or broad region, so redact details you do not want to publish.
Why can the route change between two tests?
Routing updates, load balancing, VPN use, source-network changes, and other traffic-engineering decisions can send later probes along a different path. A trace is a time-bound observation.

About The Author
Vigneshwaran Vijayakumar
Founder, Developer and Publisher of ClockTools | Digital Marketing Manager | India
Vigneshwaran is an engineer with decades of technical experience, including professional work as a Digital Marketing Manager in Dubai. His work connects data analysis, search engine optimization, conversion-rate optimization, content systems, visual production, and applied AI and machine learning. At ClockTools, he turns that multidisciplinary experience into focused browser utilities and practical, source-aware guides.