Internet Speed Tools
What Do Internet Speed Test Results Mean?
Read download, upload, ping, and jitter as four different measurements, then use controlled comparisons to turn one speed-test snapshot into useful evidence.
By Vigneshwaran Vijayakumar, Developer and Publisher | | Reviewed under the ClockTools editorial policy

Table of contents
A speed test can say “fast” while a video call still stutters. It can also show a lower download number than yesterday while everything you do online feels normal. Neither result is contradictory. The test is measuring several different parts of one connection, from one device to one endpoint, during a short window of time.
Internet speed test results describe capacity, response time, and consistency. Download and upload report how much data moved per second. Ping estimates how long a small browser request took to make a round trip. Jitter shows how much those response times changed across repeated samples. None of those figures, by itself, is a universal grade for “the internet.”
This guide gives you a reading order that is more useful than chasing the largest number on the screen.
Read the result as four different measurements
Start by separating the values. A download result is not another version of ping, and jitter is not a smaller upload score. Each metric answers a different question.
| Result | Unit | The useful question it answers | Direction that usually looks better |
|---|---|---|---|
| Download | Mbps | How much test data reached this device per second? | Higher |
| Upload | Mbps | How much test data this device sent per second? | Higher |
| Ping | ms | How long did a small browser request and response take? | Lower |
| Jitter | ms | How much did the repeated response times vary? | Lower and steadier |
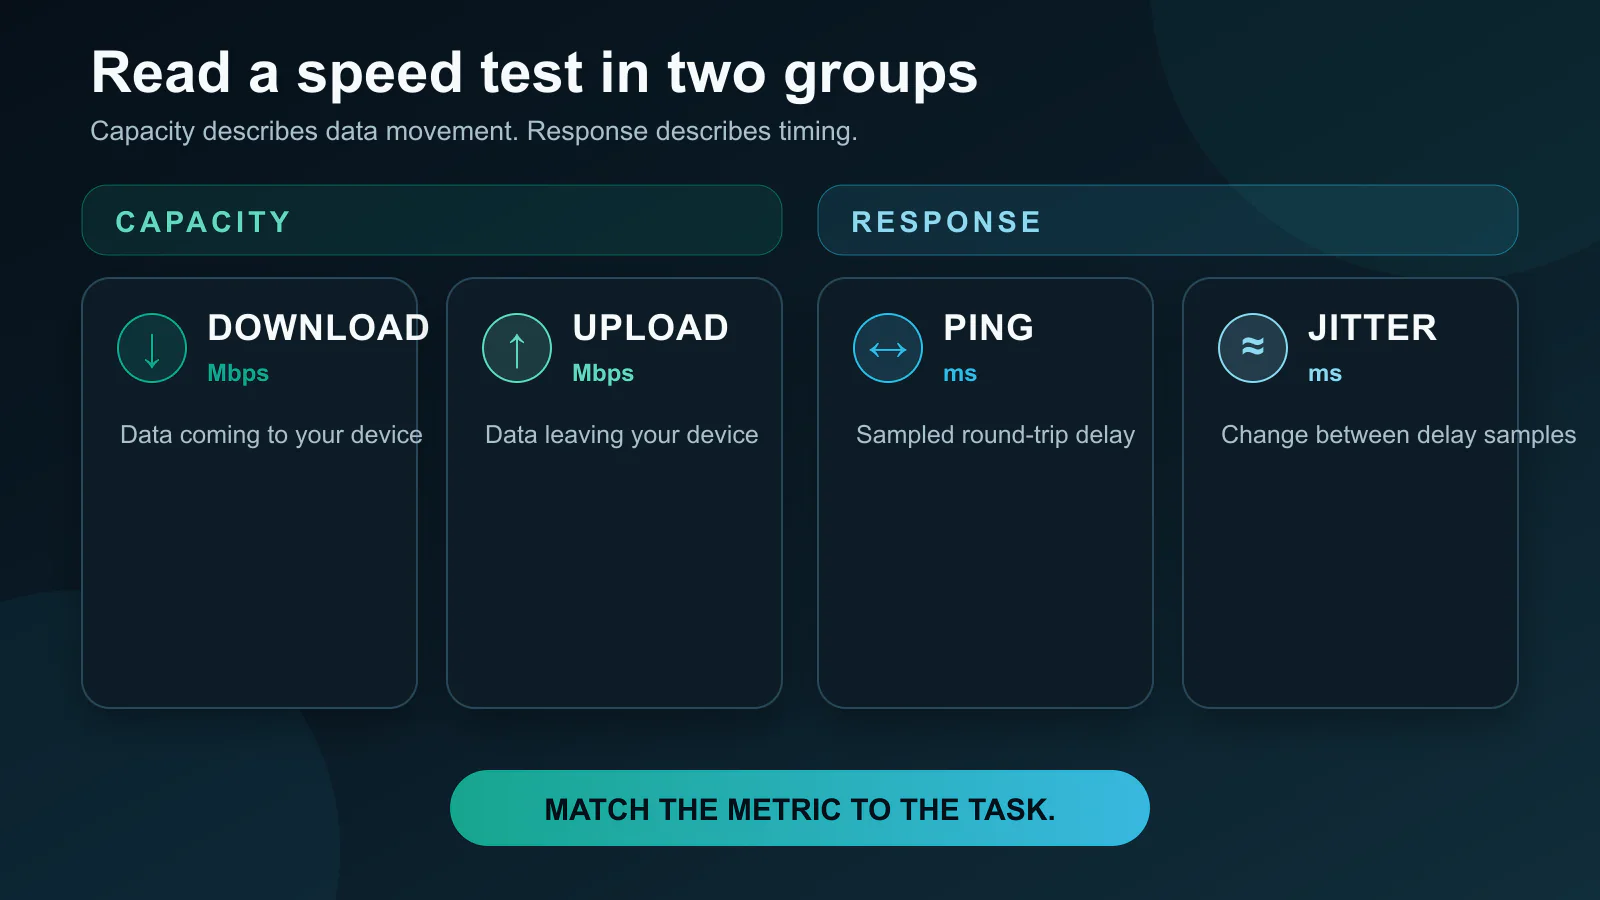
That division immediately explains why a connection can have plenty of download capacity but still feel awkward during an interactive task. A large file transfer mainly needs sustained capacity. A conversation also needs timely, consistent responses. You have to read the metric that matches the activity.
It also explains why one browser test cannot certify every path you use. The result belongs to the route between your device and that test endpoint. M-Lab’s discussion of speed-test accuracy and methodology notes that server placement and test design can make two legitimate tests report different values.
Download is capacity toward you
Download speed describes the rate at which test data traveled from the endpoint to your browser. It is expressed in megabits per second, or Mbps. More available download throughput helps when several streams, pages, updates, or file transfers are competing to receive data.
The important word is available. A browser test does not reveal a permanent speed stored inside the router. It measures what the full path delivered to this device during the test. That path includes the device, its Wi-Fi or cable connection, the router, the provider, interconnections, the route to the endpoint, and the endpoint itself.
A low download result therefore narrows the investigation, but it does not identify the culprit. Compare the result on the same device near the router, then over Ethernet when practical. If the wired result is consistently stronger, the local wireless link deserves attention. If both are weak, the bottleneck may be elsewhere.
Upload is capacity away from you
Upload speed reverses the direction. It measures how much test data traveled from your browser to the endpoint per second. It matters when your device is the sender: sharing a large file, synchronizing a cloud folder, publishing media, backing up data, or contributing your camera and microphone stream to a call.
An upload figure can be much lower than the download figure without indicating a failed test. Many plans are asymmetric by design. The useful comparison is with the upload performance your provider says the plan should normally deliver, not with the download number beside it.
Upload saturation can also affect other people using the connection. A busy backup or media upload may fill queues and make small interactive requests wait. That is one reason “the download result looks fine” is not the end of a video-call diagnosis.
Ping and jitter describe two kinds of waiting
Speed-test interfaces often use ping as shorthand for a small-request round-trip measurement. ClockTools times a browser request to the selected edge endpoint and the response back to the browser. The value includes more than distance: local wireless access, routing, queueing, endpoint handling, and the return path can all contribute.
Jitter asks a different question: were those response times steady? ClockTools estimates it from the absolute changes between consecutive browser ping samples. Other tools may use other formulas. The IETF’s IP Packet Delay Variation specification defines delay variation for selected packet pairs and shows why “jitter” is not one universally interchangeable calculation.
Read the pair together:
- A consistently short round trip produces low ping and low variation.
- A consistently longer round trip can produce higher ping but modest jitter.
- A connection whose responses swing from quick to delayed can show noticeable jitter even when the average ping looks ordinary.
Real-time activities are especially sensitive to changing delay because late data is harder to hide in a live conversation or interaction. Jitter does not directly measure Wi-Fi signal strength, packet loss, or a game server. It is evidence that the sampled response timing was inconsistent.
Some speed tests also report loaded latency, which measures responsiveness while download or upload traffic is active. The FCC’s Measuring Broadband America report treats idle latency and latency under load as separate observations. ClockTools currently reports its browser ping samples before the throughput stages, so do not rename that figure “loaded latency.”
What does Mbps mean in a speed-test result?
Mbps means megabits per second. The lowercase b matters. File sizes and download dialogs are often expressed in megabytes, abbreviated with an uppercase B.
Eight bits make one byte, so an 80 Mbps data rate corresponds to a theoretical 10 MB per second before protocol overhead, source limits, storage speed, and other real-world constraints. Divide Mbps by eight when you want a rough Mbps-to-MB/s comparison. Do not expect every file download to hold that calculated rate; the remote service and the route to it may be slower than the speed-test endpoint.
This unit mismatch is why a result can appear eight times larger than the number in a download window without anything being wrong. They may be describing the same flow with different units.
Why can a fast result still feel slow?
“Fast” usually refers to throughput, while “feels fast” often includes responsiveness and stability. Those are related, but they are not substitutes.
A page can pause before it begins loading even when the connection can later transfer a large file quickly. A call can break up during brief timing swings. One remote service can be overloaded while a nearby speed-test endpoint performs well. A device can struggle to render a page after the network has already delivered it.
The reverse can happen too. A modest throughput result may be perfectly adequate for the one task in front of you if that task transfers little data and the connection remains responsive.
This is why a quality badge should be treated as a summary, not a verdict. ClockTools combines core measurements into a quick connection-quality label, but the individual download, upload, ping, and jitter values tell you which behavior produced the experience. The label is a convenience, not an industry certification or a promise about every application.
Use patterns, not isolated numbers
The fastest route from a result to a useful next step is to look for a repeatable pattern.
| Pattern you observe | What it may suggest | Comparison that can separate the possibilities |
|---|---|---|
| Download is repeatedly weaker on Wi-Fi than Ethernet | The local wireless link may be limiting the device | Test the same device, endpoint, and profile near the router and over cable |
| Upload drops while a backup is running | Other outgoing traffic may be consuming available upload capacity | Pause the known upload, then repeat under the same conditions |
| Ping is steady but longer only through a VPN | The VPN route or endpoint adds delay | Confirm the route change with What Is My IP, then compare VPN on and off |
| Jitter changes sharply between rooms | Wireless interference or signal conditions may contribute | Hold the device, test profile, and time window constant while changing location |
| One test service reports a different throughput result | Endpoint, route, protocol, sample size, or test design may differ | Repeat each service consistently; do not average unlike methods into one score |
| The speed test looks normal but one website is slow | The site, its delivery path, or browser rendering may be the constraint | Check that page with the website rendering test and compare another site |
| Results weaken at similar busy times | Shared local usage or wider congestion may be involved | Record several tests at matched times across multiple days |
Notice the language in the middle column: may suggest. A speed test observes end-to-end performance; it does not open the network and point to a broken component. Ofcom likewise recommends testing more than once and distinguishes Wi-Fi conditions from the broadband line in its broadband and Wi-Fi troubleshooting guidance.
If throughput is fine but the route itself is the question, the two tools should not be confused. A traceroute result shows responding hops and round-trip samples; it does not measure download or upload throughput.
How does ClockTools produce the result?
The ClockTools internet speed test runs in the browser against a ClockTools edge endpoint. It first makes eight small requests, averages their round-trip times for ping, and estimates jitter from the change between consecutive samples. It then transfers staged download and upload payloads and converts bytes over elapsed time into Mbps.
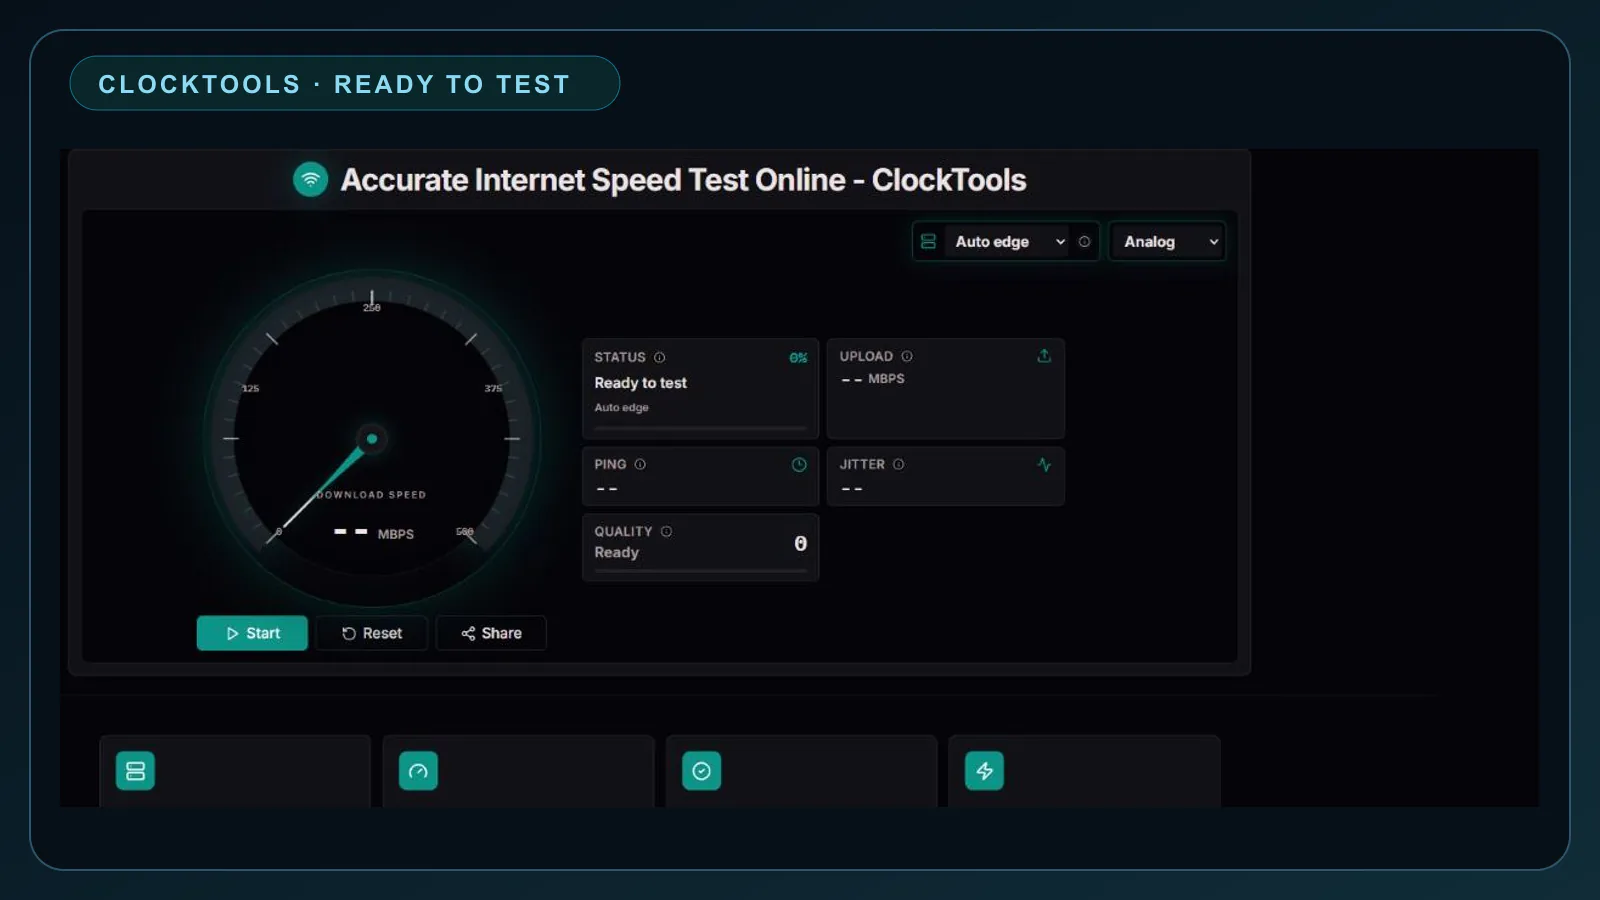
The three test profiles change the amount of sample data:
- Quick edge uses smaller transfers for a faster estimate.
- Auto edge balances test time and sample size.
- Deep edge uses larger transfers to give a fast broadband connection more room to settle.
ClockTools reports the strongest throughput observed across the stages. That result is useful for seeing what this browser-to-edge path achieved during the run. It is not a direct reading from the provider’s equipment, and it does not guarantee that every website will deliver at the same rate.
Analog and digital modes change the presentation, not the connection. The result cards are the evidence: download, upload, ping, and jitter. Read them before the overall quality label, and keep the same profile when you are comparing two runs.
Run a comparison that answers one question
Random retesting creates a pile of numbers. A controlled comparison creates evidence. Change one condition at a time.
- Choose the question, such as whether Wi-Fi location, a VPN, or background traffic is affecting the result.
- Keep the same device, browser, ClockTools profile, and test endpoint.
- Pause unrelated transfers if you want a clean baseline, or leave normal activity running if you want to measure the experience under ordinary use.
- Run more than one test and record the time, connection type, and condition you changed.
- Compare the pattern, not the single best run.
For a provider-plan comparison, start with Ethernet when available and compare repeated results with the plan’s published typical download, upload, and latency information. For a Wi-Fi experience comparison, test where the device is actually used. Those are different questions, and both can be valid.
The OECD review of access-network speed tests cautions that methodologies and purposes affect whether two speed indicators can be compared. Keeping your own method consistent is the simplest way to avoid that trap.
The best conclusion is narrower than “my internet is bad”
A useful reading sounds like this: “Download and upload were repeatable on Ethernet, but Wi-Fi jitter rose in the back room,” or “This browser-to-edge path lost upload capacity whenever the backup was active.” That conclusion tells you what to test next.
Download and upload describe capacity in opposite directions. Ping describes sampled round-trip response time. Jitter describes how that timing changed. Read all four in the context of the device, route, endpoint, and task, and a speed-test screen becomes a diagnostic snapshot instead of a mysterious grade.
Frequently Asked Questions
Which internet speed test number matters most?
It depends on the task. Download matters when receiving substantial data, upload matters when sending it, ping describes sampled response time, and jitter describes how much that timing changes. Read the metric that matches the activity instead of choosing one universal winner.
What is a good internet speed test result?
A useful result is repeatable, supports the activity you care about, and is reasonably consistent with the typical performance your provider publishes for the plan. There is no single download, upload, ping, or jitter threshold that grades every household, device, route, and application.
Why is my speed test result lower than my internet plan?
A browser test includes the device, Wi-Fi or Ethernet link, router, other local traffic, provider network, internet route, and test endpoint. Compare repeated tests over Ethernet with the plan’s published typical performance before deciding that the provider connection is the cause.
Why do two speed tests give different results?
They may use different endpoints, routes, connection counts, transfer sizes, test lengths, protocols, and aggregation rules. Compare repeated results within one method before comparing values produced by different methods.
Does a browser speed test measure Wi-Fi speed or broadband speed?
It measures the complete path between that browser and the test endpoint, so a Wi-Fi-connected test includes the wireless link as well as the broadband connection. A wired comparison helps separate local wireless performance from the rest of the path.
What is the difference between Mbps and MB/s?
Mbps means megabits per second, while MB/s means megabytes per second. Eight bits make one byte, so dividing Mbps by eight gives a theoretical MB/s conversion before protocol overhead and other real-world limits.
What does jitter mean in a speed test?
Jitter describes variation across repeated delay samples. ClockTools estimates it from the changes between consecutive browser ping measurements. Other tests may calculate delay variation differently, so compare jitter values produced by the same method.
Can high download speed hide a latency problem?
Yes. A path can move a large amount of data per second while still taking longer, or varying more, when responding to small interactive requests. Read ping and jitter alongside throughput when calls, games, or remote-control sessions feel delayed.
Does an internet speed test use data?
Yes. Throughput tests transfer controlled download and upload payloads. ClockTools Quick, Auto, and Deep profiles use different sample sizes, so choose the smaller Quick profile when data use or test time matters.

About The Author
Vigneshwaran Vijayakumar
Founder, Developer and Publisher of ClockTools | Digital Marketing Manager | India
Vigneshwaran is an engineer with decades of technical experience, including professional work as a Digital Marketing Manager in Dubai. His work connects data analysis, search engine optimization, conversion-rate optimization, content systems, visual production, and applied AI and machine learning. At ClockTools, he turns that multidisciplinary experience into focused browser utilities and practical, source-aware guides.