Weather Calculator Tools
How Does the Magnus Dew Point Formula Work?
A step-by-step Magnus dew point calculation with a worked example, validation checks, and practical limits.
By Vigneshwaran Vijayakumar, Developer and Publisher | | Reviewed under the ClockTools editorial policy
Table of contents
The Magnus dew point formula turns two ordinary measurements—air temperature and relative humidity—into an estimate of the temperature at which that air would become saturated. The practical answer is simple: convert the temperature to Celsius, calculate a logarithmic helper value from relative humidity, then transform that value into dew point. Use the result as an estimate for weather, comfort, or condensation checks, not as a substitute for a calibrated environmental measurement.
What is the Magnus dew point formula?
The formula is an approximation built from the relationship between temperature and saturation vapor pressure. A commonly used liquid-water form is:
γ(T, RH) = ln(RH / 100) + (a × T) / (b + T)
Td = (b × γ) / (a - γ)
Here, T is air temperature in degrees Celsius, RH is relative humidity as a percentage, Td is dew point in degrees Celsius, and ln is the natural logarithm. One widely used constant pair is a = 17.625 and b = 243.04°C. Other published implementations use nearby constants because they were fitted for different temperature ranges or reference formulations.
The formula does not say that the air will actually cool. It answers a conditional question: if the same air parcel cooled at broadly constant pressure without gaining or losing water vapor, at what temperature would it reach saturation? The National Weather Service definition of dew point uses that same physical idea.
This is also why dew point is not simply “humidity converted to degrees.” Relative humidity depends on both moisture and the current air temperature. Dew point is a more direct indicator of the moisture already present.
How do you calculate dew point step by step?
Use this sequence when you need an auditable hand calculation.
- Convert the air temperature to Celsius if necessary:
T°C = (T°F - 32) × 5 / 9. - Convert relative humidity from percent to a fraction inside the logarithm:
RH / 100. - Calculate
ln(RH / 100). - Calculate the temperature term
(a × T) / (b + T). - Add the two terms to obtain
γ. - Calculate
Td = (b × γ) / (a - γ). - Convert the result back to Fahrenheit only if needed:
Td°F = Td°C × 9 / 5 + 32.
Keep extra digits during the intermediate steps and round only the final result. Early rounding is particularly noticeable at low relative humidity because the logarithm changes more sharply there.
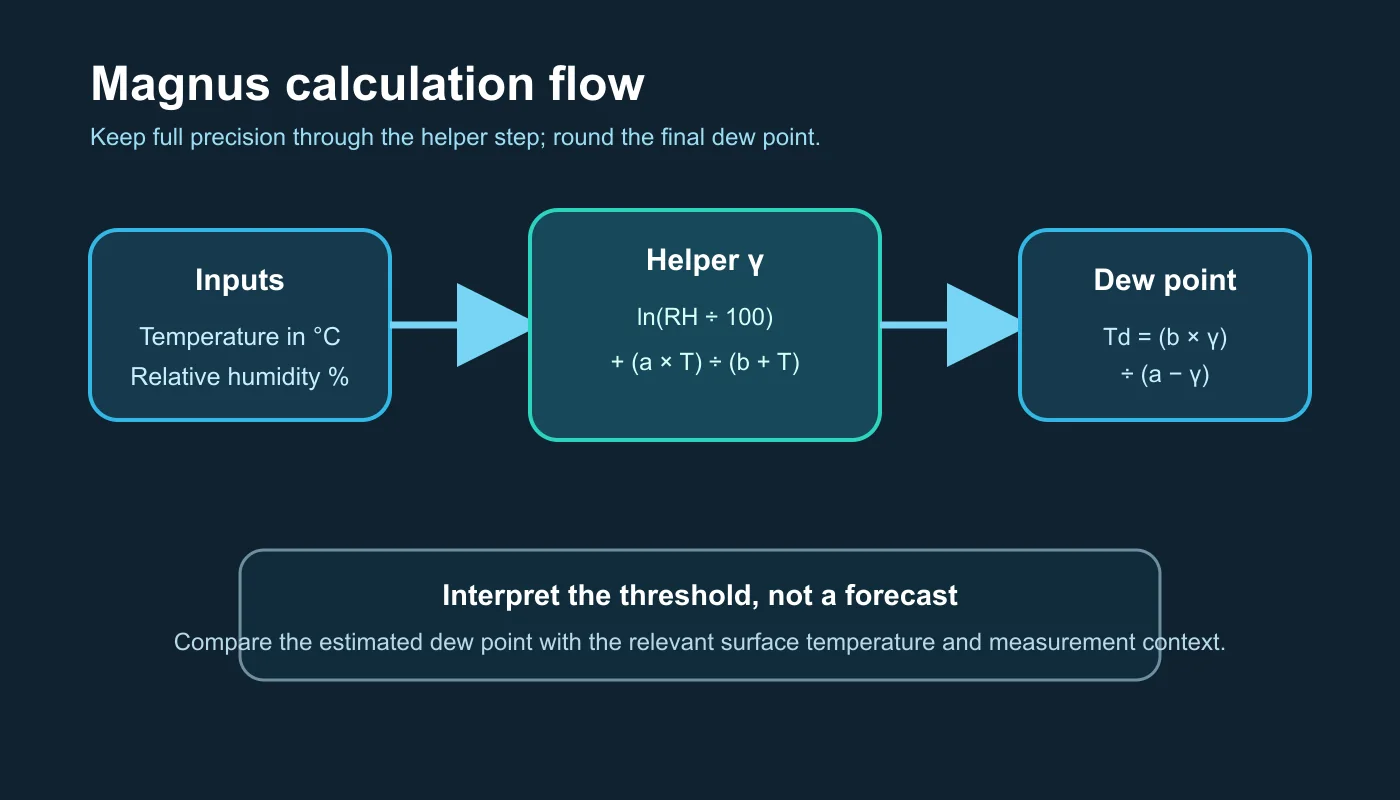
The diagram is a calculation map, not measured weather data. It shows where unit conversion, the logarithm, and final rounding belong.
What does a worked 25°C example produce?
Suppose the air temperature is 25°C and relative humidity is 55%. Using a = 17.625 and b = 243.04°C:
ln(55 / 100) ≈ -0.5978
(17.625 × 25) / (243.04 + 25) ≈ 1.6439
γ ≈ -0.5978 + 1.6439 = 1.0461
Td ≈ (243.04 × 1.0461) / (17.625 - 1.0461) ≈ 15.3°C
That result means a surface near 15.3°C could begin collecting condensation from adjacent air represented by those inputs. It does not mean the outdoor temperature will fall to 15.3°C, and it does not predict fog or rain by itself.
The air-temperature-to-dew-point gap is about 9.7 Celsius degrees. Meteorologists call this the dew-point depression. A smaller gap means the air is closer to saturation at its current temperature. The National Weather Service glossary defines the depression as the difference between air temperature and dew point.
Why do Magnus constants vary?
Search for this formula and you may find 17.27 with 237.7, 17.625 with 243.04, or another nearby pair. Those are not random disagreements. Magnus-type equations are fitted approximations, and a fit can use a different saturation-vapor-pressure reference, phase assumption, or temperature interval.
| Choice | What it changes | Sensible practice |
|---|---|---|
| Constant pair | The curve fitted to saturation vapor pressure | Record the pair with the result |
| Liquid water or ice | The reference phase below freezing | Use a phase-appropriate formulation for cold technical work |
| Input units | Whether the constants expect Celsius | Convert before evaluating the formula |
| Rounding | The displayed decimal places | Round only after the final step |
| Sensor quality | The accuracy of temperature and RH inputs | Treat calculated precision as no better than the measurements |
For an everyday browser estimate, consistency matters more than choosing constants to many decimal places. For laboratory, industrial, archive, or building-envelope work, use the method required by the governing procedure and document sensor calibration, pressure assumptions, and applicable range.
What did three controlled checks show?
I reproduced three input pairs in the live ClockTools dew point calculator and compared the pattern with the formula rather than treating the label as a black box.
| Air temperature | Relative humidity | Expected behavior | ClockTools observation |
|---|---|---|---|
| 25°C | 55% | Dew point below air temperature | 15.3°C, with a 9.7°C depression |
| 25°C | 100% | Dew point converges on air temperature | Saturation case returns approximately the input temperature |
| Same temperature, lower RH | Lower moisture fraction makes ln(RH/100) more negative | Dew point falls and the depression grows |
Two interface details are useful for checking work: the result appears in both Celsius and Fahrenheit, and the calculator exposes dew-point depression beside the dew point. The page also identifies its calculation method as a Magnus approximation, so the estimate is not presented as a direct instrument reading.
These checks establish direction and reproducibility, not universal accuracy. Feeding a calculator two numbers can confirm its implementation; it cannot validate where a sensor was mounted or whether those readings represent the air around the surface you care about.
How much confidence should you put in the result?
The weakest input usually controls the useful accuracy. A temperature sensor warmed by direct sun, a humidity sensor beside a shower, or a reading taken in an air-conditioner outlet can be precise on screen and still be unrepresentative.
Relative-humidity uncertainty also propagates unevenly. Near saturation, a small RH change usually produces a modest dew-point change. In dry air, the logarithm means the same percentage-point error can have a larger effect. This is a reason to show one decimal place for an everyday estimate, not six decimals that imply survey-grade certainty.
Pressure is another boundary. The standard two-input approximation assumes ordinary near-surface conditions and broadly constant pressure for the cooling thought experiment. High-altitude, compressed-gas, process, and cryogenic work can require pressure-aware or composition-specific methods.
The National Weather Service humidity discussion also cautions against turning saturation into a rain forecast. Air at 100% relative humidity at one level is saturated there; precipitation requires deeper cloud processes and sufficient droplet or ice-crystal growth.
When should you use a different method?
Use the simple Magnus estimate for everyday weather comparison, comfort context, and first-pass condensation reasoning. Escalate when the consequence of a wrong result is larger than the convenience of a quick approximation.
| Situation | Why the simple estimate is not enough | Better next step |
|---|---|---|
| Below-freezing process control | Saturation over ice can matter | Use a phase-appropriate standard or instrument |
| Compressed air or gas mixtures | Pressure and composition differ from ordinary air | Use the specified engineering method |
| Museum, archive, or clean-room control | Tight tolerances and calibration matter | Use calibrated monitoring and the facility procedure |
| Hidden wall condensation | Surface temperature and airflow vary locally | Measure surfaces and investigate the assembly |
| Fog or precipitation forecasting | Vertical structure, mixing, lift, and wind matter | Read a full local forecast and sounding analysis |
| Health-sensitive indoor dampness | Mold and exposure depend on duration and materials | Use professional building or health guidance |
The calculator is most valuable when it helps you ask the next concrete question: is the surface colder than the estimated dew point, is the temperature-dew-point spread narrowing, or are the inputs themselves trustworthy?
How should you use the estimate in practice?
For condensation, pair the air calculation with a surface temperature. If indoor air is 22°C with a calculated dew point of 13°C, a window surface at 16°C is above that estimate, while a metal frame at 11°C is below it. The second surface deserves attention even though both share the same room air.
For weather, compare a time series rather than one isolated value. A steady dew point with rising afternoon temperature can coincide with falling relative humidity even though the amount of moisture changes little. Overnight cooling can reverse the relative-humidity pattern while the dew point moves much less.
For repeatable notes, save five fields: air temperature, relative humidity, formula/constants, estimated dew point, and measurement context. Add the surface temperature when condensation is the concern. That record is far more useful than a screenshot of one unlabeled result.
If you need a transparent everyday estimate, enter the measured pair in the dew point calculator. If the issue is heat stress rather than condensation, the heat index calculator answers a different question by combining temperature and humidity into an apparent-temperature estimate.
Frequently Asked Questions
What is the Magnus formula for dew point?
It is a two-stage approximation. First calculate gamma from Celsius temperature and the natural logarithm of relative humidity as a fraction. Then transform gamma with the selected Magnus constants to estimate dew point in Celsius.
Which Magnus constants should I use?
For an everyday liquid-water estimate, a common pair is a = 17.625 and b = 243.04°C. Other valid pairs are fitted for different references or ranges, so record the constants and use the method required by your application.
Can dew point be higher than air temperature?
Under ordinary surface conditions with internally consistent measurements, dew point should not exceed air temperature. A small apparent exceedance usually points to sensor uncertainty, rounding, mismatched sampling locations, or rapidly changing conditions.
Does a dew point calculation predict condensation?
It identifies a temperature threshold. Condensation becomes plausible when a nearby surface reaches or falls below that dew point, but airflow, surface properties, measurement accuracy, and changing moisture still matter.
Why does the formula use a natural logarithm?
Relative humidity scales the saturation vapor pressure at the current temperature. Taking its natural logarithm helps invert the exponential saturation-pressure relationship and solve approximately for the saturation temperature.
Is the Magnus formula accurate enough for engineering work?
It can be useful within a specified range, but engineering work should follow the applicable standard and account for pressure, phase, gas composition, sensor calibration, and required uncertainty. An everyday two-input calculator is not process certification.

About The Author
Vigneshwaran Vijayakumar
Founder, Developer and Publisher of ClockTools | Digital Marketing Manager | India
Vigneshwaran is an engineer with decades of technical experience, including professional work as a Digital Marketing Manager in Dubai. His work connects data analysis, search engine optimization, conversion-rate optimization, content systems, visual production, and applied AI and machine learning. At ClockTools, he turns that multidisciplinary experience into focused browser utilities and practical, source-aware guides.